Grafana
Table of Contents
1. What is Grafana?
It is an open source monitoring tool with visualisation. It can read from variety of sources. It is not a database.
1.1. See Grafana in action
Go to https://play.grafana.com to get a quickly get an idea about what it looks like.
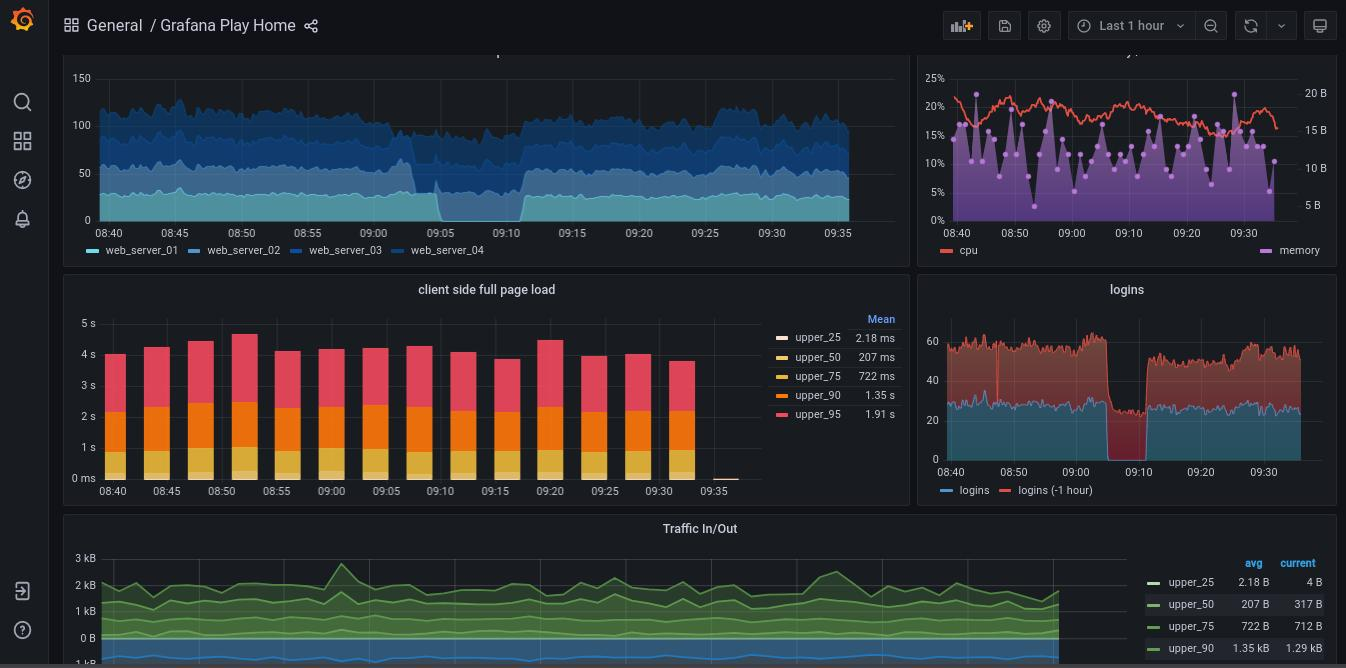
Figure 1: figure name
1.2. Public dashboards
Companies like GitLab and Wikimedia use it and have their dashboards public.
Some examples of public grafana dashboards
GitLab: https://dashboards.gitlab.com/ Wikimedia: https://grafana.wikimedia.org/?orgId=1 GridKa: https://grafana-sdm.scc.kit.edu/d/jEtLX97mz/gridka-overview?refresh=30m&orgId=1
Watch this wonderful webinar to learn about Grafana in 1 hour.1
2. Grafana is open source
Available on GitHub, start using it. There are hosted instances as well. Grafana Cloud can also be used. Go to https://grafana.com/ and sign up for a free account and start using it.
3. Learn Grafana
Go to https://grafana.com/tutorials/ and start by Grafana fundamentals.
4. How it works
Data producer <–> Data Source (database) <– Grafana/Grafana Dashboard
- Data producer could be Raspberry Pi, Jenkins
- Data Source can pull data from data producer. It could be a database like MySQL
- Grafana will query
Watch this video to know about Grafana in 5 mins.
5. Dashboard
- Interactive
- Zoom in
- Logs can be viewed in dashboard as well
- Curated set of visualisation that tells a story
5.1. Metric
CPU Load, Memory Usage
5.2. Log
Application logs with timestamp
6. How to start using it
- Signup for a cloud instance or install it on your local.
- Add a data source
Footnotes:
Webinar to learn about Grafana https://www.youtube.com/watch?v=0n2UNzk2OaI